Category:Software development methodology
Jump to navigation
Jump to search
English: Software development methodology in software engineering is a framework that is used to structure, plan, and control the process of developing an information system, the software development process.
process by which software is developed | |||||
| Upload media | |||||
| Subclass of |
| ||||
|---|---|---|---|---|---|
| Facet of | |||||
| |||||
Subcategories
This category has the following 19 subcategories, out of 19 total.
A
C
D
I
J
- Jackson Structured Programming (14 F)
M
O
- Open Unified Process (2 F)
P
- Personal Software Process (2 F)
S
- Service-oriented modeling (24 F)
- Spiral model of Boehm (14 F)
- Systems Development Life Cycle (14 F)
T
V
- V-models (25 F)
W
- Waterfall models (33 F)
Media in category "Software development methodology"
The following 144 files are in this category, out of 144 total.
-
7 Process CLM.png 258 × 258; 44 KB
-
Aasd workflow v2.png 1,266 × 901; 51 KB
-
Abstract monitor with IDE.png 1,500 × 923; 40 KB
-
Accelerator Architecture.png 1,316 × 1,269; 798 KB
-
Agile-vs-iterative-flow.jpg 672 × 335; 153 KB
-
Alm phasen.png 1,000 × 680; 142 KB
-
Animatic of 3D Mayo Smith Pyramid.gif 960 × 540; 1,011 KB
-
Branch politic.png 788 × 310; 24 KB
-
CCC VModell.png 500 × 307; 54 KB
-
Ciclo de vida soa.png 682 × 428; 88 KB
-
Circuit breaker pattern state diagram.svg 568 × 424; 13 KB
-
Circuit breaker pattern.svg 561 × 1,759; 78 KB
-
Classification Tree for Database System.png 806 × 303; 14 KB
-
Classification Tree for Embedded System.png 538 × 343; 11 KB
-
Co - founder for Creative Thoughts Informatics Services Pvt Ltd.jpg 5,184 × 3,456; 5.7 MB
-
Continuous Delivery process diagram.png 585 × 419; 55 KB
-
Continuous Delivery process diagram.svg 780 × 559; 128 KB
-
Cycle.v.jpg 300 × 300; 9 KB
-
CyclesBasiques.jpg 830 × 591; 99 KB
-
Cyclesemi.png 645 × 371; 44 KB
-
Data comp.jpg 505 × 460; 20 KB
-
Data Masking Steps.jpg 288 × 622; 26 KB
-
Design Chart.png 900 × 613; 191 KB
-
Developing dependable software for a system-of-systems (IA developingdepend1094510039).pdf 1,275 × 1,650, 265 pages; 2.89 MB
-
Development-iterative.png 493 × 317; 12 KB
-
DevOps from Integration to Deployment.jpg 4,944 × 1,588; 373 KB
-
DevOps from Integration to Deployment.png 4,945 × 1,589; 358 KB
-
Devops Traduzido.png 400 × 380; 77 KB
-
Devops-toolchain.svg 512 × 290; 16 KB
-
Devops.png 478 × 384; 45 KB
-
Devops.svg 512 × 486; 19 KB
-
Diagrama Vista-VistaModel-Model.png 1,517 × 298; 61 KB
-
ECT Example Test Case Graph c.svg 556 × 664; 40 KB
-
ECT Example Test Case Graph.svg 900 × 675; 40 KB
-
Estimation accuracy vs time.gif 379 × 293; 4 KB
-
Event driven programming Simply Explained.jpg 800 × 600; 86 KB
-
Evolutionary prototyping model.jpg 768 × 351; 18 KB
-
Evolutionary prototyping process model.png 1,022 × 1,010; 118 KB
-
Fagan Inspection Simple flow.svg 1,018 × 178; 12 KB
-
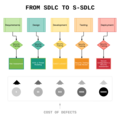
From SDLC to SSDLC.png 2,475 × 2,473; 145 KB
-
Fuck it, ship it (7175475750).jpg 612 × 612; 151 KB
-
Fuck it, ship it (8195359323).jpg 612 × 612; 148 KB
-
General-strategy-evol.jpg 2,451 × 2,154; 494 KB
-
Goal-driven software development.png 701 × 606; 15 KB
-
Hudak LOP vs Conventional.gif 1,313 × 770; 40 KB
-
Inc-Software-Arch-Process.png 1,920 × 940; 2.03 MB
-
Incremental Software Architecture Process.jpg 622 × 215; 38 KB
-
Iterative Development Concept.PNG 503 × 266; 8 KB
-
Iterative development model V2 bg.jpg 423 × 222; 27 KB
-
Iterative development model V2.jpg 423 × 222; 25 KB
-
Iterative development model-pl.svg 512 × 271; 3 KB
-
Iterative development model.svg 512 × 271; 1 KB
-
Iterative Process Diagram.svg 512 × 287; 23 KB
-
Lucasian.png 573 × 439; 29 KB
-
Magic Turtle.png 623 × 624; 27 KB
-
Mark Zuckerberg - Move Fast and Break Things.jpg 1,664 × 1,248; 382 KB
-
Maturity matrix.png 852 × 345; 24 KB
-
Method.png 592 × 445; 78 KB
-
Modelo dra.jpg 400 × 297; 41 KB
-
Modelo Gral Evolutivo Incremental.jpg 529 × 265; 47 KB
-
Modelo Incrementalyeye.jpg 400 × 269; 47 KB
-
Modelo Iterativo Incremental.jpg 775 × 400; 81 KB
-
Modelo Iterativo Incremental.svg 800 × 310; 52 KB
-
Modelos del Método Blue Watch (Jonás Montilva).PNG 960 × 720; 36 KB
-
Modèle Itératif.PNG 981 × 620; 61 KB
-
Move Fast and Break Things (14071866872) (cropped).jpg 1,075 × 1,515; 319 KB
-
Move Fast and Break Things (14071866872).jpg 3,264 × 2,448; 1.23 MB
-
Move fast and break things (5455395458).jpg 2,460 × 3,690; 2.03 MB
-
Multidimensional Software Architecture Environment.png 2,550 × 1,434; 3.01 MB
-
Oasis1.png 479 × 288; 39 KB
-
OWASP SAMM spanish.png 994 × 309; 52 KB
-
Petersen graph SSDLC.png 2,018 × 2,106; 232 KB
-
Ponyplusplus.gif 400 × 300; 355 KB
-
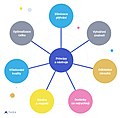
Principy a nastroje.jpg 800 × 784; 158 KB
-
Proceso Ing Requisitos.svg 950 × 550; 25 KB
-
Process and data modeling cz.svg 674 × 542; 44 KB
-
Process and data modeling.jpg 638 × 507; 44 KB
-
Process and data modeling.svg 638 × 507; 15 KB
-
Project RISHI Methodology.pdf 1,650 × 1,275; 197 KB
-
QualityGatesSoftwareentwicklung.png 1,125 × 744; 47 KB
-
Quytrinh2.png 695 × 162; 100 KB
-
Rad15.gif 499 × 286; 16 KB
-
Rad16.gif 508 × 250; 12 KB
-
RADModel bg.jpg 780 × 499; 52 KB
-
RADModel.JPG 780 × 499; 27 KB
-
Rapid application software development.svg 700 × 200; 8 KB
-
Rup-folyamatok.png 611 × 407; 49 KB
-
Sample Kanban Board.pdf 2,000 × 1,125; 522 KB
-
Sans titregfgggg.png 719 × 600; 227 KB
-
Scale Cube.png 697 × 499; 73 KB
-
Schema cycle developpement.png 800 × 600; 22 KB
-
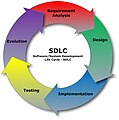
SDLC - Software Development Life Cycle.jpg 2,351 × 2,364; 301 KB
-
SOA DEFINICION.png 855 × 428; 288 KB
-
Software Dev Stages ta.svg 300 × 635; 31 KB
-
Software dev.svg 300 × 635; 8 KB
-
Software dev2 hr.svg 300 × 635; 110 KB
-
Software dev2-ca.svg 356 × 645; 34 KB
-
Software dev2.svg 300 × 635; 87 KB
-
Software Development Lifecycle Diagram.png 409 × 409; 14 KB
-
Software development methodologies.jpg 1,164 × 661; 74 KB
-
Software Implementation Dimensions.png 2,550 × 1,434; 1.56 MB
-
Software retirement diagram.png 1,740 × 912; 218 KB
-
SoftwareDevelopmentLifeCycle.jpg 726 × 494; 92 KB
-
Stage Gate Decision Making.jpg 556 × 417; 32 KB
-
Sw dev cycle.jpg 752 × 442; 78 KB
-
System Development Life-cycle diagram.png 2,063 × 1,582; 263 KB
-
TaxonomieMéthodologies.PNG 1,261 × 807; 85 KB
-
Test-driven development uk.png 683 × 490; 23 KB
-
Test-driven development.PNG 683 × 490; 18 KB
-
Test-driven development.svg 685 × 488; 109 KB
-
Testing Terminologies.pdf 1,239 × 1,754, 51 pages; 208 KB
-
The ARTI reference architecture - PROSA revisited.svg 990 × 765; 113 KB
-
Three key factors to develop secure software.png 2,000 × 2,000; 131 KB
-
Three software development patterns mashed together cz.svg 950 × 900; 32 KB
-
Three software development patterns mashed together.svg 950 × 900; 32 KB
-
Traditional software development life cycle diagram.png 2,546 × 630; 138 KB
-
UnifiedProcessProjectProfile20060708.png 455 × 180; 4 KB
-
Urdad for system design.pdf 1,239 × 1,754, 14 pages; 581 KB
-
US27 Article V2 copy 1 01.png 79 × 40; 338 bytes
-
US27 Article V2 copy 1 02.png 79 × 40; 328 bytes
-
US27 Article V2 copy 1 03.png 79 × 40; 258 bytes
-
US27 Article V2 copy 1 04.gif 286 × 78; 2 KB
-
US27 Article V2 copy 1 05.gif 168 × 46; 535 bytes
-
US27 Article V2 copy 1 06.gif 74 × 74; 355 bytes
-
US27 Article V2 copy 1 07.gif 168 × 46; 540 bytes
-
US27 Article V2 copy 1 08.gif 286 × 80; 2 KB
-
US27 Article V2 copy 1 09.gif 168 × 46; 583 bytes
-
US27 Article V2 copy 1 10.gif 142 × 46; 486 bytes
-
US27 Article V2 copy 1 11.gif 294 × 48; 696 bytes
-
US27 Article V2 copy 1 12.gif 168 × 46; 570 bytes
-
US27 Article V2 copy 1 13.gif 142 × 46; 489 bytes
-
US27 Article V2 copy 1 14.gif 306 × 168; 3 KB
-
US27 Article V2 copy 1 15.gif 278 × 56; 1 KB
-
US27 Article V2 copy 1 16.gif 168 × 46; 548 bytes
-
US27 Article V2 copy 1 17.gif 142 × 46; 493 bytes
-
US27 Image A.png 1,028 × 378; 15 KB
-
US27 Image D.png 483 × 121; 3 KB
-
US28 Image D.png 597 × 173; 8 KB
-
US29 Image D.png 616 × 814; 46 KB
-
UserFacingFeatureProcessTemplate.svg 1,488 × 1,052; 72 KB
-
Waterfall model.png 515 × 396; 19 KB
-
Спецификации и уровни разработки.png 750 × 500; 73 KB
-
Схема взаимодействия в методологии Devops.svg 765 × 735; 14 KB








.pdf.jpg)





.jpg)
.jpg)


.png)

_(cropped).jpg)
.jpg)
.jpg)


